associations#
- class pdcleaner.detection.values.associations(obj, detector=None, count=None, freq=None)[source]#
Bases:
_TwoColsCategoricalDataFramesDetectorDetects least frequent associations between two category columns
Intended to be used by the detect method with the keyword ‘associations’
>>> dataframe.cleaner.detect.associations(...)
>>> dataframe.cleaner.detect('associations',...)
- Parameters:
count (int) – Minimal number of samples in which the categories values must be associated
freq (float between 0 and 1) – Minimal frequency of samples in which the categories values must be associated
warning – One must provide either count or freq, and not both
- Raises:
TypeError – if count is not an integer if freq is not a float
ValueError – if neither count nor freq is provided if count and freq are both provided if freq is not >0 and <1
Examples
>>> import pandas as pd
>>> import pdcleaner
>>> df = pd.DataFrame({
            'col1': ['A'] * 10 + ['B'] * 10,
            'col2': ['a'] * 8 + ['c'] * 2 + ['b'] * 9 + ['a'],
    })
>>> detector = df.cleaner.detect.associations(freq=0.05)
>>> print(detector.detected())
    col1 col2
19    B    a
>>> detector = df.cleaner.detect.associations(count=3)
>>> print(detector.detected())
    col1 col2
8     A    c
9     A    c
19    B    a
Attributes Summary
Minimal number of samples
Minimal frequency of samples
Indices of the rows detected as errors
Minimal count or frequency
Number of rows detected as errors
True if working with frequencies
The object (Series or DataFrame) containing the data to which the detection is applied
List of valid associations
Methods Summary
detected()Series or DataFrame containing only the detected errors
Returns True if any error has been detected, False otherwise
is_error()Return a boolean same-sized object indicating if the values are flagged as errors
Return a boolean same-sized object indicating if the values are NOT flagged as errors
plot([color, errors_color, fmt])plot a colored matrix (heatmap) représentation of categories associations.
report()prints a detection report
valid()Series or DataFrame containing only the valid values
Attributes Documentation
- count#
Minimal number of samples
- freq#
Minimal frequency of samples
- index#
Indices of the rows detected as errors
- limit#
Minimal count or frequency
- n_errors#
Number of rows detected as errors
- name = 'associations'#
- normalize#
True if working with frequencies
- obj#
The object (Series or DataFrame) containing the data to which the detection is applied
- valid_associations#
List of valid associations
Methods Documentation
- detected()#
Series or DataFrame containing only the detected errors
- has_errors() bool#
Returns True if any error has been detected, False otherwise
- is_error() Series#
Return a boolean same-sized object indicating if the values are flagged as errors
- not_error() Series#
Return a boolean same-sized object indicating if the values are NOT flagged as errors
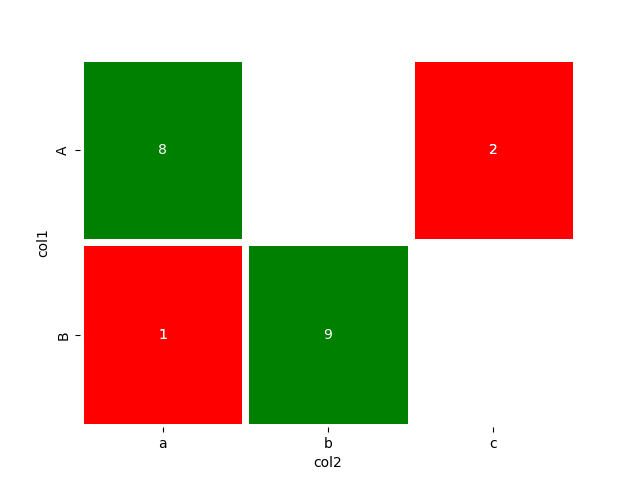
- plot(color='green', errors_color='red', fmt='.0f')#
plot a colored matrix (heatmap) représentation of categories associations.
- Parameters:
color (palette name (Default: "green")) – Color associated to legitimate associations. Should be something that can be interpreted by seaborn’s color_palette()
errors_color (palette name (Default: "red")) – Color associated to erroneous associations. Should be something that can be interpreted by seaborn’s color_palette()
fmt (format (default : ".0f")) – String formatting code to use for the numbers.
- Returns:
ax – Axes object with the heatmap.
- Return type:
matplotlib Axes
Example
>>> import pandas as pd
>>> import pdcleaner
>>> df = pd.DataFrame({
            'col1': ['A'] * 10 + ['B'] * 10,
            'col2': ['a'] * 8 + ['c'] * 2 + ['b'] * 9 + ['a'],
    })
>>> detector = df.cleaner.detect.associations(count=3)
>>> detector.plot()
- report()#
prints a detection report
- valid()#
Series or DataFrame containing only the valid values