Numerical Series detectors#
- pdcleaner.plots.numseries.plot(self, color='green', errors_color='red', compact=False, limits=True, figsize=None)[source]#
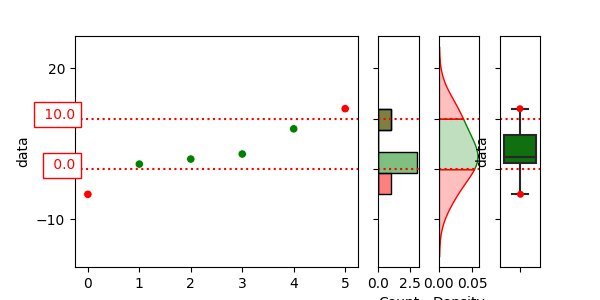
plot a visualization representing an overview of the treated data and colored according to the validity of the values:
a scatter plot representing the values in the treated series.
a histogram representing the distribution of values.
a kernel density estimate plot visualizing the distribution of values.
a boxplot showing the distribution of values.
- Parameters:
color (palette name (Default: "green")) – Color associated to legitimate values. Should be something that can be interpreted by seaborn’s color_palette()
errors_color (palette name (Default: "red")) – Color associated to erroneous values. Should be something that can be interpreted by seaborn’s color_palette()
compact (Bool (Default: False)) – If True, compact the plots around valid values and show the number of erroneous values on the scatter plot
limits (Bool (Default: True)) – If True, draw horizontal lines showing the lower and upper values delimiting the allowed values
figsize ((float, float) (Default: None)) – width and height of the figure.
- Returns:
axs – an array of length 4 containing the matplotlib axes representing the plots
- Return type:
array of matplotlib.axes._subplots.AxesSubplot
Examples
>>> series = pd.Series([-5, 1, 2 , 3, 8, 12])
>>> detector = series.cleaner.detect.bounded(lower=0, upper=10)
>>> detector.plot()