counts#
- class pdcleaner.detection.values.counts(obj, detector=None, n=1)[source]#
Bases:
_SeriesDetectorDetect class values that appear at max n times.
Intended to be used by the detect method with the keyword ‘counts’.
>>> series.cleaner.detect.counts(...)
>>> series.cleaner.detect('counts',...)
This detection method flags values as potential errors wherever the corresponding Series element appears less or = than n times in the Series.
Note
NA values are not treated as errors.
- Parameters:
n (integer > 0 (Default: 1)) – Number of occurences under which the element is flagged as an error
- Raises:
ValueError – when n is <= 0
TypeError – when n is not an integer
Examples
>>> series = pd.Series(['cat','cat','dog','dog','bird'])
>>> detector = series.cleaner.detect.counts(n=1)
>>> print(detector.values)
['cat','dog']
>>> print(detector.is_error())
0    False
1    False
2    False
3    False
4     True
dtype: bool
Use resulting object to apply to another series: only the previously detected valid values are considered valid.
>>> series_test = pd.Series(['dog','bird','mouse','cat'])
>>> detector_test = series.cleaner.detect(detector)
>>> print(detector_test.is_error())
0    False
1     True
2     True
3    False
dtype: bool
The detector can also be used with numerical values:
>>> series_test = pd.Series([5, 3, 3.0, 100, 5])
>>> detector_test = series_test.cleaner.detect.counts(n=1)
>>> print(detector_test.is_error())
0    False
1    False
2    False
3     True
4    False
dtype: bool
Missing values are not treated as errors.
>>> series = pd.Series(['cat',np.nan,'dog','bird'])
>>> detector = series.cleaner.detect.counts(n=1)
>>> print(detector.is_error())
0    False
1    False
2    False
3     True
dtype: bool
Attributes Summary
Indices of the rows detected as errors
Minimum number of occurences
Number of rows detected as errors
The object (Series or DataFrame) containing the data to which the detection is applied
List of valid classes
Methods Summary
detected()Series or DataFrame containing only the detected errors
Returns True if any error has been detected, False otherwise
is_error()Return a boolean same-sized object indicating if the values are flagged as errors
Return a boolean same-sized object indicating if the values are NOT flagged as errors
plot([nfirst, nlast, figsize, color, ...])plot a countplot of values frequency, with options to compact the graph
report()prints a detection report
valid()Series or DataFrame containing only the valid values
Attributes Documentation
- index#
Indices of the rows detected as errors
- n#
Minimum number of occurences
- n_errors#
Number of rows detected as errors
- name = 'counts'#
- obj#
The object (Series or DataFrame) containing the data to which the detection is applied
- values#
List of valid classes
Methods Documentation
- detected()#
Series or DataFrame containing only the detected errors
- has_errors() bool#
Returns True if any error has been detected, False otherwise
- is_error() Series#
Return a boolean same-sized object indicating if the values are flagged as errors
- not_error() Series#
Return a boolean same-sized object indicating if the values are NOT flagged as errors
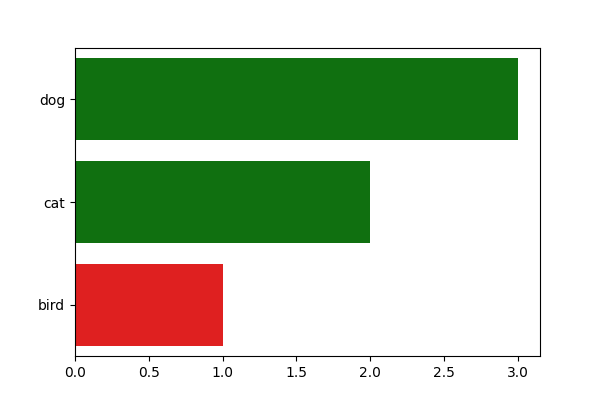
- plot(nfirst=0, nlast=0, figsize=None, color='green', errors_color='red', not_displayed_color='grey')#
plot a countplot of values frequency, with options to compact the graph
- Parameters:
nfirst (int) – Number of top n values to display
nlast (Bool (Default: True)) – Number of n last values to display
figsize ((float, float) (Default: None)) – width and height of the figure.
color (palette name (Default: "green")) – Color associated to legitimate values. Should be something that can be interpreted by seaborn’s color_palette()
errors_color (palette name (Default: "red")) – Color associated to erroneous values. Should be something that can be interpreted by seaborn’s color_palette()
not_displayed_color (str, color name (Default = "grey")) – Box color for the number of hidden values
- Returns:
axs – matplotlib axes objects representing the plots
- Return type:
matplotlib.axes._subplots.AxesSubplot
- Raises:
ValueError if nfirst or nlast is <0 –
TypeError if nfirst or nlast is not an integer –
Examples
>>> series = pd.Series(['cat','cat','dog', 'dog','dog','bird'])
>>> detector = series.cleaner.detect.freq(freq=.2)
>>> detector.plot()

>>> detector.plot(nfirst=1, nlast=1)
- report()#
prints a detection report
- valid()#
Series or DataFrame containing only the valid values